

Memory leaks cause performance problems, slow down applications and can lead to terminate a process causing browsers to get stuck.
Leaks occur on your javascript code when one of the allocated object maintains a reference to another object after code execution. Another scenario is when a DOM object has a reference to itself on a javascript object ( circular reference ). Since the reference never ends or breaks, garbage collection cannot return that memory back to the system, hence a leak occurs.
The previous statement is highly technical so let’s translate this into a real world scenario. Say you have 3 friends.
 Friend A
 Friend B
 Friend C

 Analogy: Consider the friends as the objects on your javascript code.
Now 2 of your 3 friends each borrowed money from you and promise to pay in a week.
 Friend A borrowed $5
 Friend B borrowed $10

 Analogy: Consider this part as when memory ( $ ) is allocated to your javascript objects ( Friends ).
Friend A keeps the money to himself. However after 2 days, Friend B loaned $3 of the money he borrowed from you to Friend C.
 Friend A Total Money = $5
 Friend B Total Money = $10 - $3 = $7 //loaned the $3 to Friend C
 Friend C Total Money = $3

 Analogy: Consider this part as when another object ( Friend C ) reference another object ( Friend B ) on your javascript code.
One week past and you came back to collect your money ( Analogous to the period when garbage collection fires ). Friend A pays up the $5 he owes from you ( Memory allocated succesfully returned to the system ). However, Friend B for some reason did not collect the money from Friend C so he only pays you $7. Now you just realized that unless Friend C returns the $3 to Friend B, you’ll never get back all your $15. Hence, a money leak ( memory leak )!
Hope that example explains Memory Leak.
Now for real, consider this Javascript code with html <a id="one" href="#">Click Me</a>:
function theObject () {
    var myArray = [];
    for(var i = 0; i < 100000; i ++){
        myArray.push (" leaking.....");
    }
    this.leakMemory = function(){
        console.log("I am" + myArray[0]);
    };
}

var b = new theObject();
document.getElementById("one").addEventListener ('click', function () {
   b.leakMemory();
});
The memory allocated on myArray will never get garbage collected since the inner function leakMemory still holds a reference to it.
To see that memory is leaking, run this code on your Chrome browser at incognito state -> developer’s tool -> timeline. Click the record button ( gray circle on the left ) and start clicking the “Click Me” link of the sample code. Click the circular red button to stop recording.
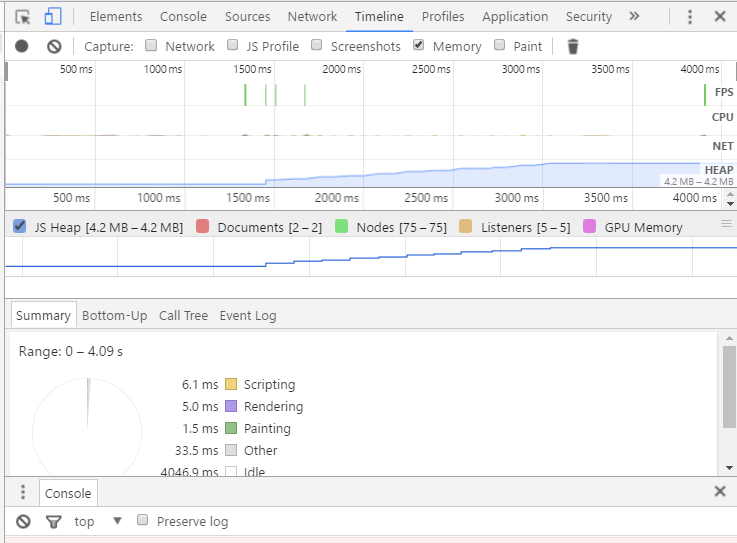
As you see from the timeline, that the “JS Heap” graph keeps increasing and never goes down. A strong signal of memory leak.
Also you can go to the Chrome developer’s profile tab, select “Take Heap Snapshot”. Once done, type the “theObject” on the textbox.
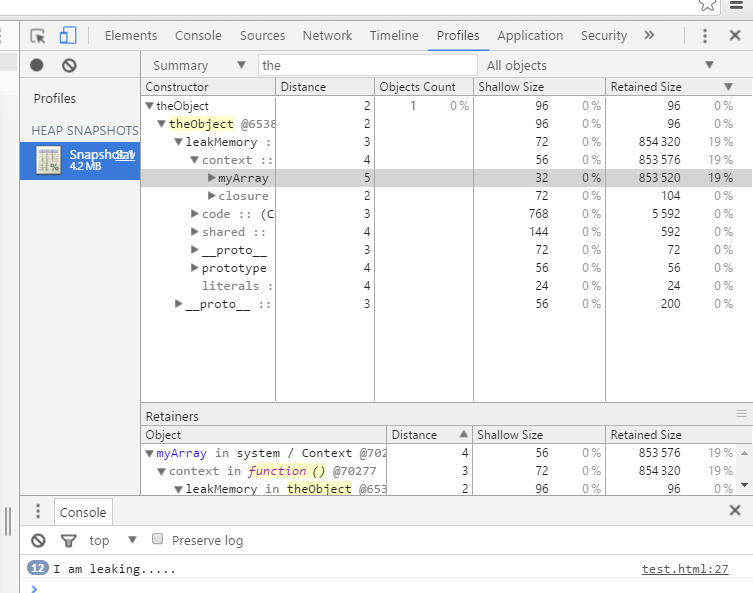
Based from the screen shot above, the myArray is highlighted showing the memory leakage. Take note of the shallow size and retained size values.
Now to fix the leak, let’s move the myArray inside the leakMemory function to break the reference ( analogously, imagine Friend B keeping the $10 to himself and pays you in whole ).
function theObject () {
    this.leakMemory = function(){
        var myArray = [];
        for(var i = 0; i < 100000; i ++){
          myArray.push (" leaking.....");
        }
        console.log("I am" + myArray[0]);
    };
}

var b = new theObject();
document.getElementById("one").addEventListener ('click', function () {
   b.leakMemory();
});
Checking the Chrome developer’s timeline again at incognito state, you should see the graph below.
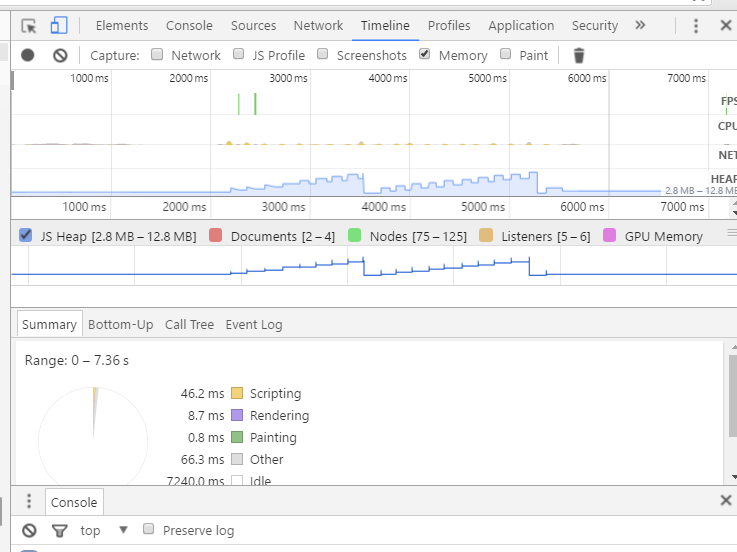
You can see a huge dip on the graph at a certain period. This is the garbage collector reclaiming the memory back to the system.
For further reading: